3–5 Metrics Recruiters Use in Talent Acquisition Analytics

Talent acquisition analytics uses recruiting and HR data to drive specific hiring decisions tied to business outcomes, not to fill dashboards. The fastest path to value is picking three to five outcome-focused metrics, mapping each to a decision you actually make (advance a source, adjust an interview panel, kill a job posting), and building the reporting from there. Everything else, including predictive models, comes later.
TL;DR:
- Focusing on three to five decision-driven talent acquisition metrics ensures better alignment with actual hiring decisions and business outcomes.
- Prioritizing outcome metrics like quality of hire and first-year retention over process metrics improves the effectiveness of analytics efforts.
- Building reliable descriptive and diagnostic analytics before pursuing predictive models reduces project failure risk and data inaccuracies.
- Limiting reports to core metrics and establishing clear definitions prevents dashboard overload and decision paralysis.
- Running constrained pilots on specific roles with predefined success criteria accelerates learning and minimizes resource waste.
Table of Contents
- What Is Talent Acquisition Analytics, and Why Does It Matter?
- Which Recruiting Metrics Should You Track First?
- What Are the Four Types of Talent Acquisition Analytics?
- How Do You Actually Implement This? A Pilot-First Playbook
- Why Do TA Analytics Projects Fail? Avoiding the Dashboard Trap
- How Structured Interview Data Sharpens Talent Acquisition Analytics
- A Recruiter’s Bottom Line on Talent Acquisition Analytics
- Sources
- FAQ
What Is Talent Acquisition Analytics, and Why Does It Matter?
Talent acquisition analytics is the practice of turning recruiting and HR data into decisions, not just reports. There’s a real difference between the two. A weekly report that says “we made 40 hires last month” is reporting. Knowing that hires sourced through employee referrals stay 18 months longer than job-board hires, and adjusting your sourcing mix because of it, is analytics.
That shift from “what happened” to “why it happened and what to do next” is exactly how Deloitte frames a mature talent acquisition analytics function: measuring efficiency, effectiveness, and impact through a staged approach that moves from descriptive analysis toward predictive analysis, with each stage connecting recruiting activity to a business result.
The business case is not abstract. SHRM’s research on linking talent data to business KPIs shows that analytics can reveal which interventions actually move outcomes, such as manager quality or onboarding design, having a larger effect on retention than the sourcing channel itself. That’s the kind of finding a gut-feel recruiting process never surfaces.
Investment appetite backs this up. Gartner’s research on 2026 CFO budget priorities shows continued spending on technology and AI across growth functions, HR analytics included. Boards want proof that hiring decisions produce revenue, retention, and productivity, not just headcount.
Practical outcomes that talent acquisition analytics has been shown to influence:
- Retention: identifying which sourcing channels or interview formats predict longer tenure.
- Productivity: correlating quality-of-hire scores with ramp time to full performance.
- Cost control: catching where cost-per-hire spikes without a matching lift in candidate quality.
- Speed: pinpointing exactly which funnel stage causes delays, instead of guessing.
Which Recruiting Metrics Should You Track First?
Most teams track too many metrics and act on almost none of them. The fix is choosing metrics that map directly to a decision, then holding yourself to consistent definitions so the numbers mean the same thing month over month.
Here are the seven metrics worth prioritizing, based on core recruiting KPIs AIHR identifies as the foundation of any talent acquisition analytics program:
- Time to fill. Days from requisition approval to accepted offer. This tells you where process bottlenecks live, but it is an activity metric, not an outcome one.
- Time to hire. Days from a candidate’s first application or contact to acceptance. Narrower than time to fill, and more useful for comparing candidate experience across sources.
- Offer acceptance rate. Percentage of offers accepted. A falling rate usually points to compensation gaps, slow processes, or a competitor outbidding you.
- Quality of hire. Typically a blended score combining performance ratings, ramp time, and manager satisfaction at 90 days and one year. This is the outcome metric everything else should serve.
- First-year retention. Percentage of hires still employed at 12 months. Pairs with quality of hire to reveal whether you’re hiring people who both perform and stay.
- Source effectiveness. Cost, speed, and quality broken out by channel (referral, job board, agency, direct sourcing). This is where budget reallocation decisions get made.
- Cost-per-hire and yield ratios. Cost-per-hire tells you spend efficiency; yield ratios (applications to phone screens to offers) tell you where your funnel leaks candidates.
The distinction between activity-based and outcome-based metrics matters more than most teams realize. Time to fill and cost-per-hire describe your process. Quality of hire and first-year retention describe whether the process actually worked. Track both, but weight decisions toward the outcome side, because a fast, cheap hiring process that produces poor performers is not a win no matter how the activity metrics look.
Statistic Callout: Practitioner consensus across recruiting metric guides converges on a specific number: teams that limit their core reporting to five to seven decision-driven metrics make more consistent hiring decisions than teams tracking dozens of data points that never connect to an action.
Pro Tip: Standardize your time windows before you compare anything across roles or quarters. “Time to fill” measured in calendar days for one requisition and business days for another will produce numbers that look like a trend but are actually a measurement artifact.
One more caveat worth internalizing early: small sample sizes lie convincingly. Wait for enough volume before you trust a trend direction.
What Are the Four Types of Talent Acquisition Analytics?
Deloitte’s framework breaks talent acquisition analytics into four stages, and understanding where you sit on that ladder tells you what to attempt next. Trying to build predictive models before your descriptive numbers are reliable is the single most common way TA analytics projects fail.
- Descriptive analytics answers “what happened.” Example: 340 candidates applied for a sales role, 28 got phone screens, 6 got offers, 4 accepted.
- Diagnostic (relative) analytics answers “why, compared to what.” Example: your acceptance rate for referral candidates is 78%, versus 41% for job-board candidates, so something in the referral experience or fit is working better.
- Analytic analytics goes deeper into causal relationships across multiple variables. Example: candidates who complete a structured interview within seven days of applying accept offers at a meaningfully higher rate than those who wait three weeks, independent of role or salary band.
- Predictive analytics forecasts future outcomes. Example: a model estimates which currently open requisitions are at risk of missing their fill-date target based on early funnel conversion patterns.
The sequencing matters. A team that gets reliable, well-defined descriptive and diagnostic reporting in place often captures most of the near-term value before it needs to touch a predictive model at all. Jumping straight to predictive scoring on top of messy, inconsistently defined data just produces confident-looking numbers that are wrong.
That said, most organizations should:
- Nail descriptive reporting first: consistent definitions, clean data, reliable weekly or biweekly numbers.
- Layer in diagnostic comparisons second: source versus source, role versus role, interviewer versus interviewer.
- Attempt analytic, multi-variable analysis once you trust the inputs.
- Treat predictive models as an experiment, not a system of record, until they’ve been checked against real outcomes for at least a few hiring cycles.
Pro Tip: When you build your first predictive signal, hold back a portion of historical hires as a test set the model never saw during training. If the model’s predictions on that held-back group don’t track with actual quality-of-hire or retention outcomes, the signal is overfit to noise, not a real pattern. Recheck it every quarter, not once and done.
How Do You Actually Implement This? A Pilot-First Playbook
Skip the enterprise rollout. The fastest way to build credible talent acquisition analytics is a constrained pilot that proves value before you ask for a bigger budget or more systems.
- Scope a 6 to 8 week pilot on one role family. Pick a role with reasonable hiring volume, not your rarest executive search. A hiring manager sponsor should co-own the pilot with the TA lead.
- Choose three to five decision-driven metrics. Not seven, not fifteen. If a metric doesn’t map to a decision you’ll actually make during or right after the pilot, cut it.
- Set success thresholds before you start. Decide in advance what “this worked” looks like, whether that’s a five-day reduction in time to hire or a measurable lift in offer acceptance.
- Report on a fixed cadence. Weekly is usually right for a pilot this short. Monthly is too slow to catch problems while you can still fix them.
- Present findings in the actual hiring review, not a separate analytics meeting. If the numbers only live in a report nobody discusses during hiring decisions, the pilot has already failed regardless of what the data shows.
- Calculate ROI in outcome terms. Reduced time-to-hire translates into hiring manager hours saved and faster productivity ramp. Improved quality-of-hire scores translate into lower turnover cost. Put a number on both if you can.
Governance matters more than most pilots account for. Someone has to own metric definitions so they don’t drift between reporting periods, and someone has to validate that the underlying data is clean before it reaches a hiring manager’s inbox. The sponsor model, pairing a hiring manager with a TA lead, keeps the pilot grounded in a real decision instead of becoming an analytics exercise for its own sake.
Pro Tip: Before you scale a pilot beyond its original role family, run it against a second, different role type first. A dashboard that only works for high-volume customer support hiring often breaks when applied to a specialized engineering search where sample sizes are small and the funnel looks completely different.
Why Do TA Analytics Projects Fail? Avoiding the Dashboard Trap
The dashboard trap is the most common way talent acquisition analytics initiatives quietly die. A team builds an elaborate dashboard with 30 metrics, everyone admires it in a kickoff meeting, and six months later nobody opens it because none of those numbers connect to a decision anyone makes. Practitioner consensus across recruiting analytics guidance points to a fix that sounds almost too simple: limit core reporting to five to seven metrics that are genuinely tied to decisions, and retire anything that isn’t.
Beyond metric sprawl, watch for these failure patterns:
- Unclear definitions. If “quality of hire” means something different to two hiring managers, your comparisons across teams are meaningless.
- Siloed systems. Data trapped in the ATS that never reaches the HRIS makes it impossible to connect hiring decisions to retention outcomes.
- Misaligned incentives. Rewarding recruiters purely on time-to-fill encourages fast, low-quality hires that show up as a retention problem months later.
- Small-sample misinterpretation. Treating a rate calculated from five hires as statistically meaningful as one calculated from 500.
Before publishing any dashboard or metric, run it through a short checklist: is the definition documented, is the sample size large enough to trust, does it map to a specific decision, and is someone actually accountable for acting on it?
How Structured Interview Data Sharpens Talent Acquisition Analytics
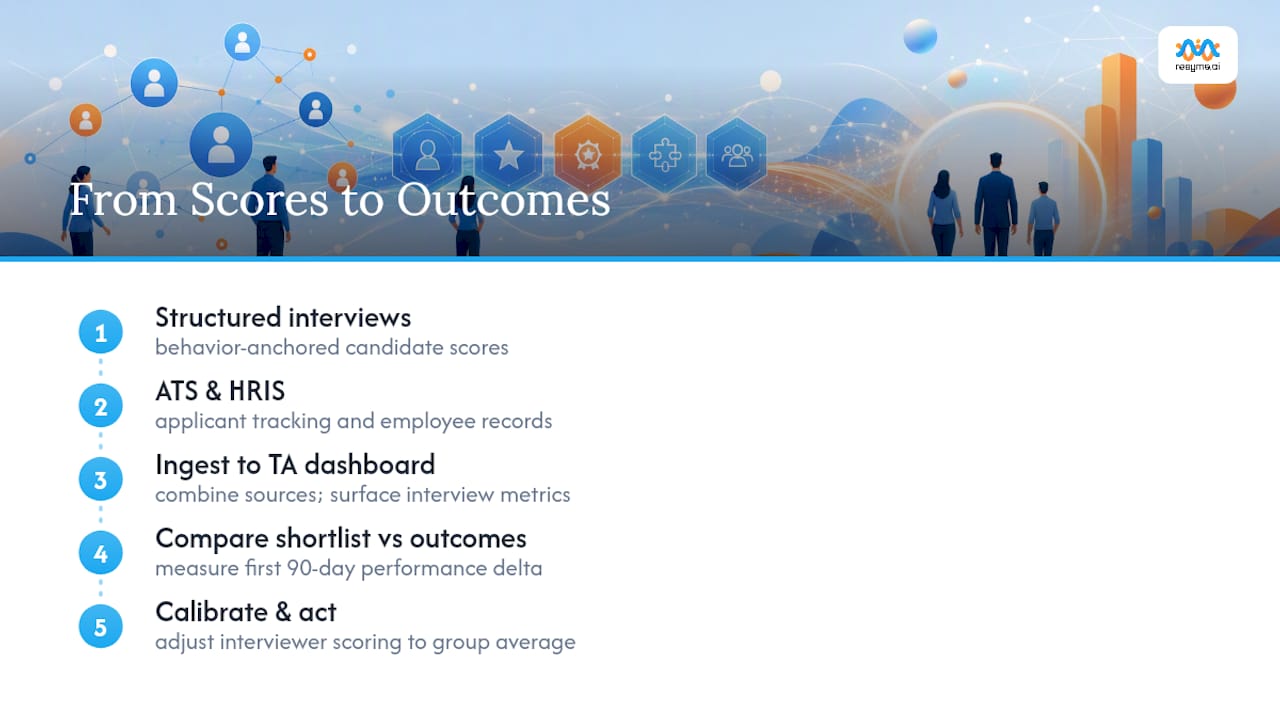
Quality of hire is the hardest metric on this list to measure well, mostly because interview data is usually inconsistent. One interviewer scores generously, another is a tough grader, and neither of the leaves notes specific enough to compare across candidates months later. Structured, evidence-mapped interviews fix this at the source by scoring every candidate against the same behavioral anchors, which is what turns interview data into a genuine analytics input rather than a subjective gut check.
Interview-level metrics like interviewer pass rates and per-question scoring patterns can be captured systematically, and that data helps calibrate interviewers whose scoring drifts too far from the group average, improving the predictive validity of the whole selection process.
This is where a platform like Resyme fits into the picture. Resyme’s AI-driven automated interviews generate role-tailored, behaviorally anchored questions and score candidates on consistent criteria, while also validating honesty and integrity signals during the conversation. That consistency matters for analytics specifically because it produces comparable data across every candidate and every recruiter, instead of scattered notes in a dozen different formats.
Practical integration point: feed structured interview scores directly into your TA dashboard alongside ATS and HRIS data, then monitor the delta between shortlist quality and actual hiring outcomes. If candidates who score well on structured interviews consistently outperform in their first 90 days, you’ve validated a genuine leading indicator, not just a nice-looking report.
A Recruiter’s Bottom Line on Talent Acquisition Analytics
The gap I keep seeing is between teams that measure recruiting and teams that use measurement to change what they do next week. Most TA analytics failures aren’t a data problem, they’re a decision problem: nobody defined which choice a given metric was supposed to inform before the dashboard got built.
If you take one thing from this guide, prioritize three moves: pick metrics tied to an actual decision, fix the data flow between your interview process, ATS, and HRIS before you touch anything predictive, and run a small, constrained pilot instead of a company-wide rollout. Treat predictive outputs as a support to human judgment, not a verdict, and recheck them against real outcomes every quarter.
— Raul
Sources
Talent acquisition analytics only works if the data underneath it is trustworthy, and that data rarely lives in one system. Deloitte’s framework specifically calls out pulling from ATS, HRIS, assessments, and survey data as the technical baseline for integrated TA reporting, and skipping any one of these leaves a blind spot.
The core systems and the fields worth capturing from each:
- Talent Acquisition Analytics | Deloitte US
- Talent Acquisition Analytics: Why You Need It & 5 Tips For Success — AIHR
- Gartner 2026 press release on CFO budget priorities
Getting these systems talking to each other doesn’t require an enterprise data warehouse on day one. Native connectors between your ATS and HRIS handle a lot of the basic sync work. For smaller teams, a disciplined CSV export routine, refreshed weekly into a shared spreadsheet or lightweight BI tool, is a legitimate starting point. Teams with more technical capacity often move to API-based syncs or a purpose-built data pipeline. If you’re evaluating that route, a partner like Vetros specializes in building the reporting layer that turns scattered recruiting data into usable products, which matters once manual exports stop scaling.
Whichever route you take, run these quality checks before you trust the output: define each metric once and document it so “time to fill” means the same thing to every recruiter, de-duplicate candidate records across systems, apply a minimum sample-size rule before reporting a rate as meaningful, and confirm your data collection meets applicable privacy and consent requirements in the regions where you hire.
FAQ
What Is the 70/30 Rule in Hiring?
Definitions vary across organizations, so treat it as a rough allocation principle rather than a fixed standard, and validate the split against your own source-effectiveness data.
Is HR Analytics a Good Career Path?
HR analytics is a growing specialization within talent acquisition and broader HR, driven by employer demand for evidence-based hiring and workforce decisions. Continued investment in tech and AI budgets across business functions, HR included, suggests demand for these skills will keep expanding.
What Are the KPIs for Talent Acquisition?
The core KPIs are time to fill, time to hire, offer acceptance rate, quality of hire, first-year retention, source effectiveness, cost-per-hire, and funnel yield ratios. AIHR recommends prioritizing outcome metrics like quality of hire and retention over pure activity metrics when making strategic decisions.
What Are the Four Types of HR Analytics?
The four types are descriptive (what happened), diagnostic or relative (why, compared to what), analytic (causal relationships across variables), and predictive (forecasting future outcomes). Deloitte’s framework recommends building descriptive and diagnostic capability first before investing heavily in predictive models.